
¶ Technical Application Guide
(Software Version 2.2.0)
This guide accompanies the BSocial SDK User Guide and the BSocial FAQ. It describes the functionality of the B-Social SDK and the output of performance evaluation and benchmarking, for the combined product covering both general-purpose (social/interactive) and automotive in-cabin deployments.
¶ Table of Contents
- Introduction
- B-Social Overview
- B-Social Features
- Appendices
¶ Introduction
This technical application guide describes the functionality of the B-Social SDK, and the output of performance evaluation and benchmarking.
The first section provides a description of the key features of the SDK, including their corresponding API. The appendices provide more in-depth information such as the physical configuration needed for deployment including the hardware and software requirements. This guide also presents the software architectural details of B-Social, its key Machine Learning models. Furthermore, this guide describes how to interpret the outputs of B-Social, particularly with respect to our approach to dimensional affect.
A guide to terminology used is provided in Appendix 1.
¶ B-Social Overview
B-Social is a software development kit (SDK) for use in robotics, mobile phones and other interactive applications, enabling the monitoring of a user's expressive behaviour via facial landmarks, facial expressions and expressed emotion.
It is built on BLUESKEYE AI's clinical-grade technology and designed with privacy and efficiency in mind. It uses BLUESKEYE AI technology to extract behavioural biomarkers from facial signals to provide insights into driver and occupant mental state and well-being. B-Social has been designed to run on edge devices without the need to transfer data to the cloud for additional processing to address data governance and privacy concerns.
B-Social will generate new opportunities for interactive applications including:
- Makes it easy to design a more engaging, empathetic and responsive social robot or virtual assistant
- Better understand your customer's journey, including the measurement of their product preferences and their levels of engagement and satisfaction with their customer experience
- Generate customer insights based on behavioural data collected ethically, objectively and repeatedly in ways that were previously impossible
- Engage empathetically with requests for customer service and personalise customers' brand experience
The current feature set focuses on monitoring users' expressive behaviours and emotional states.
B-Social can be used with either RGB or near-infrared (NIR) cameras.
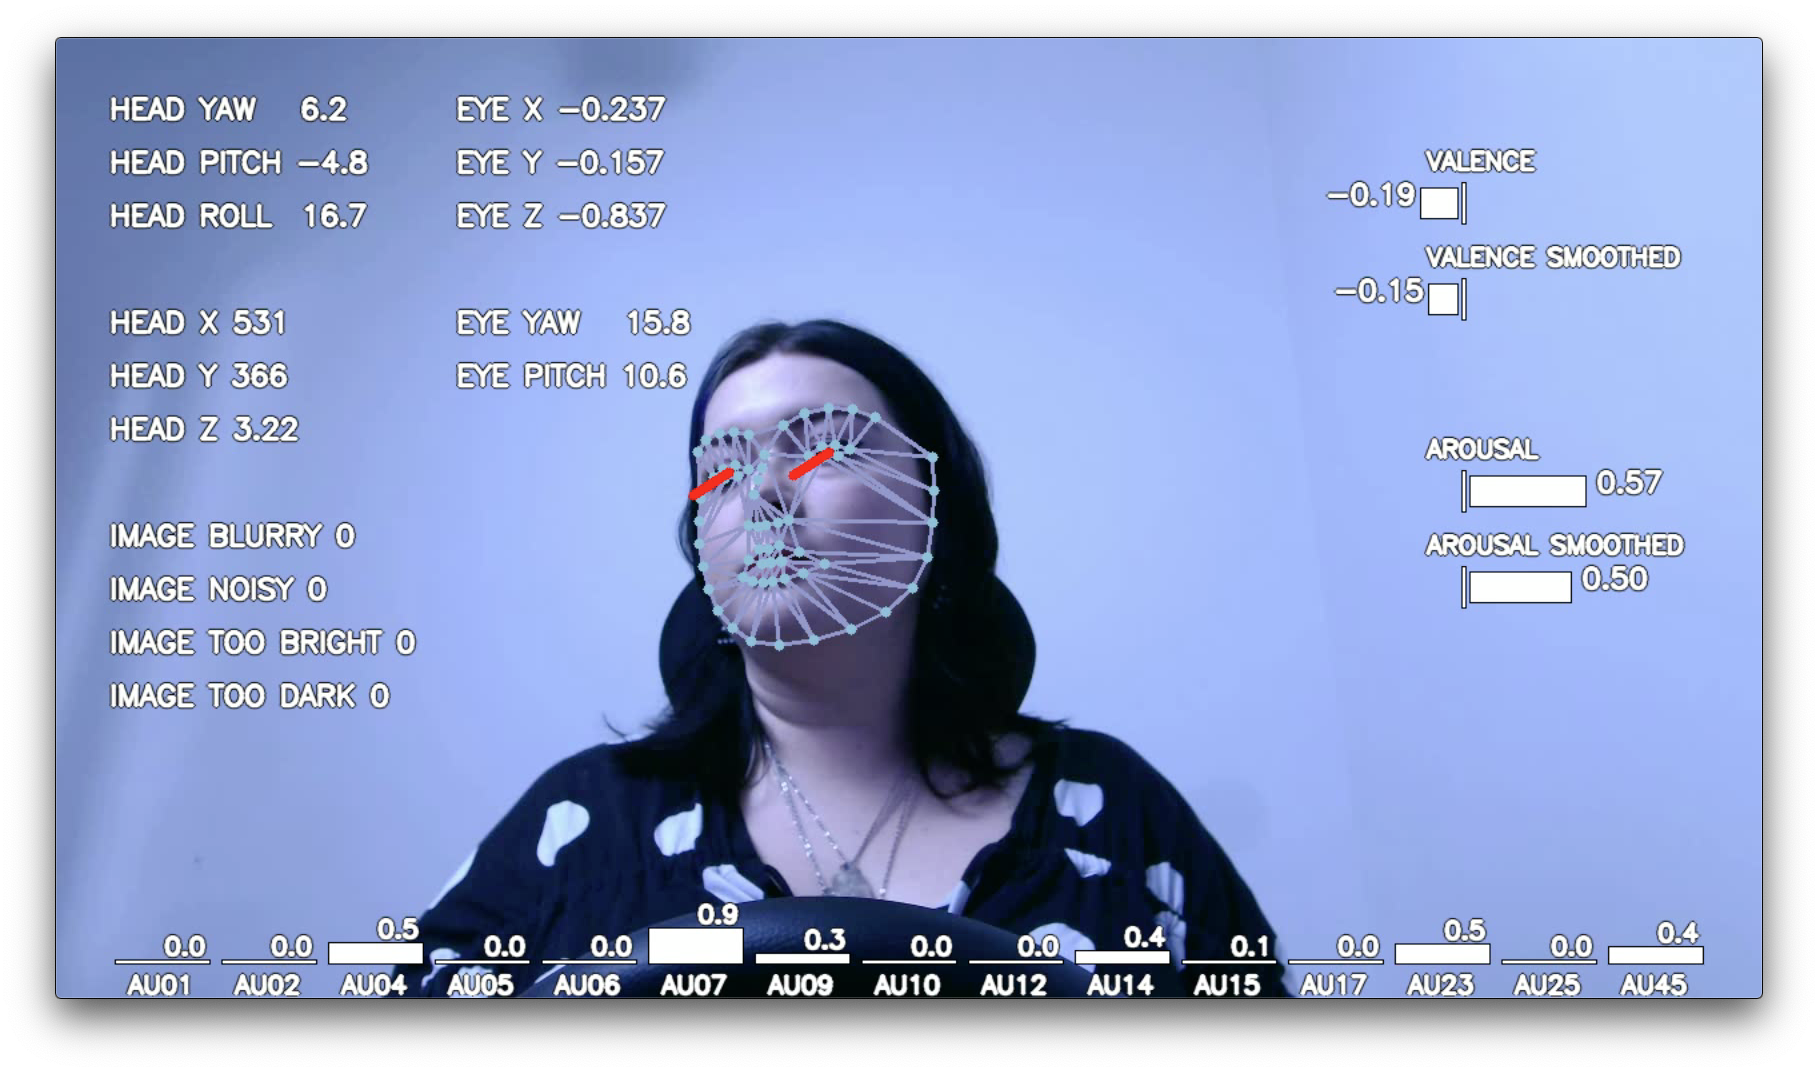
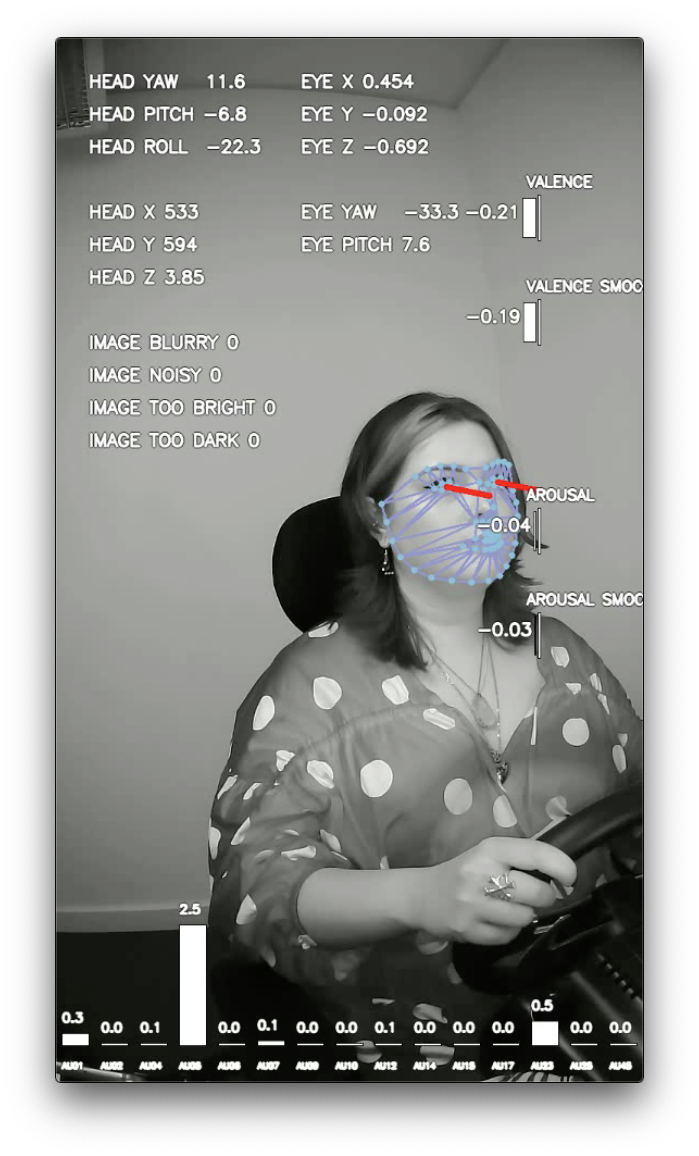
Figure 1. A sample visualisation of B-Social outputs for RGB (left) and NIR (right) inputs
¶ B-Social Features
This version of B-Social offers the following features. More detail for each of these is provided in the body of this document.
- Face detector
- Face tracking & facial landmarks
- 3D head pose
- Face image quality assessment
- Eye gaze tracking
- Attention and Social gaze
- Facial action unit estimation
- Dimensional Affect: Valence & Arousal
- 2D Expressed Emotion
- Emotion Zones
- Expressed Mood
- Visual Voice Activity Detection
See the User Guide's Functionality Overview for the additional automotive-specific capabilities (Drowsiness, Cough/Sneeze detection, CAN bus integration) and core-only capabilities (Confusion Estimation, Interaction Engagement, Audio Voice Activity Detection) that are not covered in depth in this draft of the Technical Application Guide.
¶ Face Tracking and Head Pose
¶ Face Detector
B-Social identifies multiple faces within the frame and focuses on the most prominent one. A rectangular bounding box is used to identify the 2-dimensional location of the most prominent face within the image, represented as a list of 2D spatial coordinates of the top left corner point and the bottom right corner point, i.e. [(x_min, y_min), (x_max, y_max)] (see Figure 2).
The minimum face size parameter can be set with an API call set_min_face_diagonal() in order to avoid processing faces that are far from the camera location (e.g. people more than 5m from the robot). This parameter is defined as the diagonal distance between (x_min, y_min) and (x_max, y_max). The default value for the minimum face size is 362 pixels to ensure the recommended minimum face size of 256x256 pixels is maintained.
The Face Detector module's inference is skipped for a video frame when the face landmarks are successfully detected for its previous frame. For such frames the bounding box is directly computed from the previous frame's landmark locations.
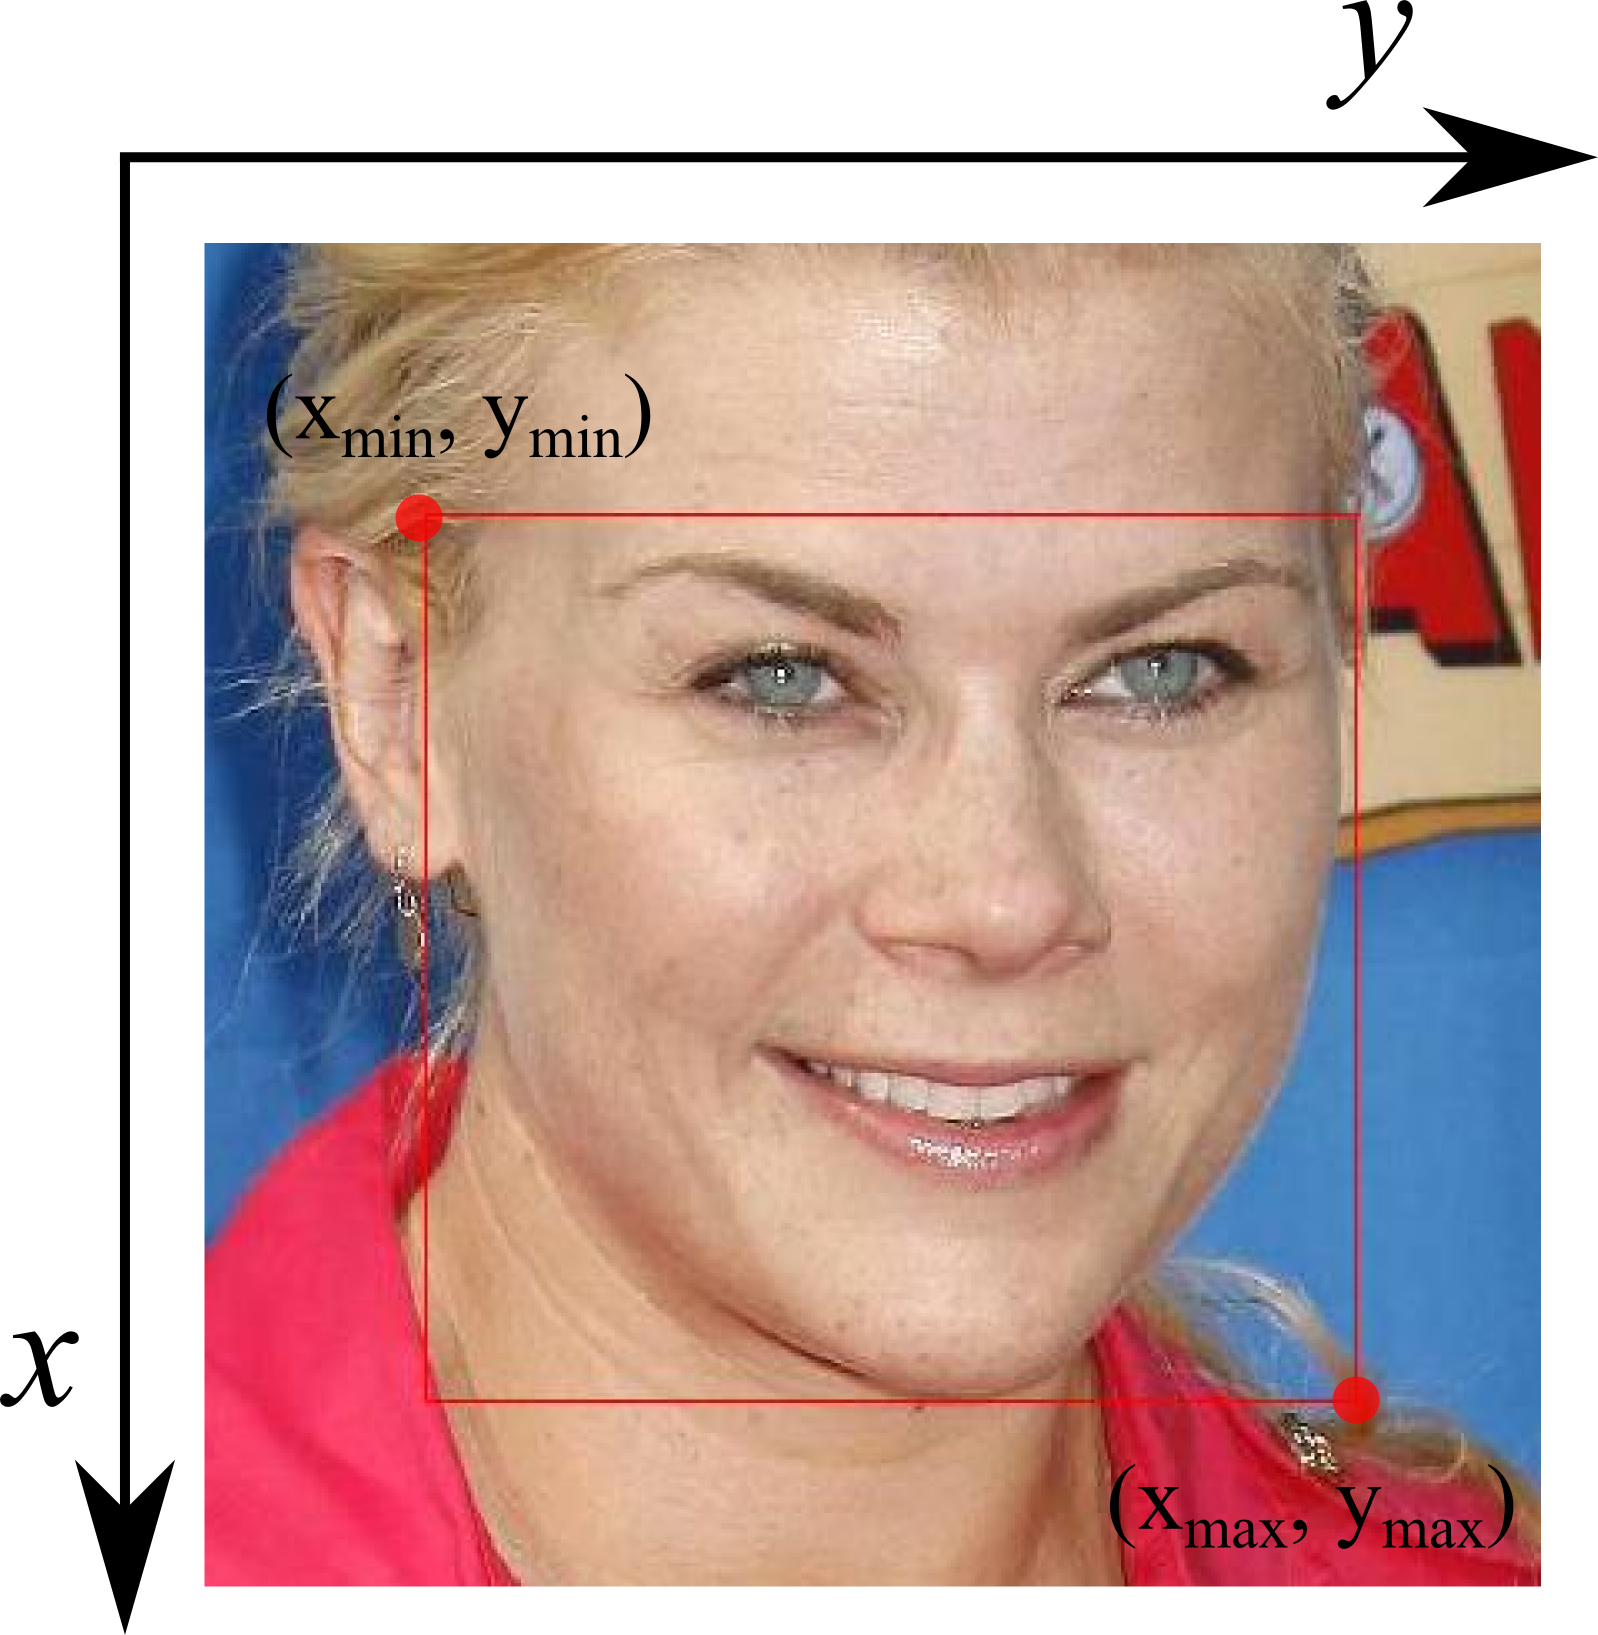
Figure 2. An illustration for a face bounding box in a 2D image (Image source: ibug.doc.ic.ac.uk/resources/300-W)
¶ Face Tracking & Facial Landmarks
B-Social tracks the primary face within the frame and identifies 68 facial landmarks on the subject. Such landmark locations are widely-used geometric descriptors of 2D face shapes, and B-Social adopts the standard i-BUG 68 point format of face landmarks (as illustrated in Figure 3).
These anatomically-defined 2D fiducial points on the facial image are represented as a 2D vector of spatial coordinates [(x_1, y_1), (x_2, y_2), ...., (x_N, y_N)].
In order to handle a subject's natural movements when seated in a vehicle, the landmark tracking model used in B-Social has been demonstrated to be capable of tracking faces with extreme yaw and pitch (head pose) angles in the ranges of [-70, +70] and [-40, +40] degrees respectively. In addition to the spatial coordinates of these 68 points, B-Social also outputs point-wise boolean visibility flags indicating the presence of occlusion over every landmark. When facial points are occluded by an external object or due to extreme head pose angles etc., B-Social outputs higher uncertainty values for such points, compared to the clearly visible points.
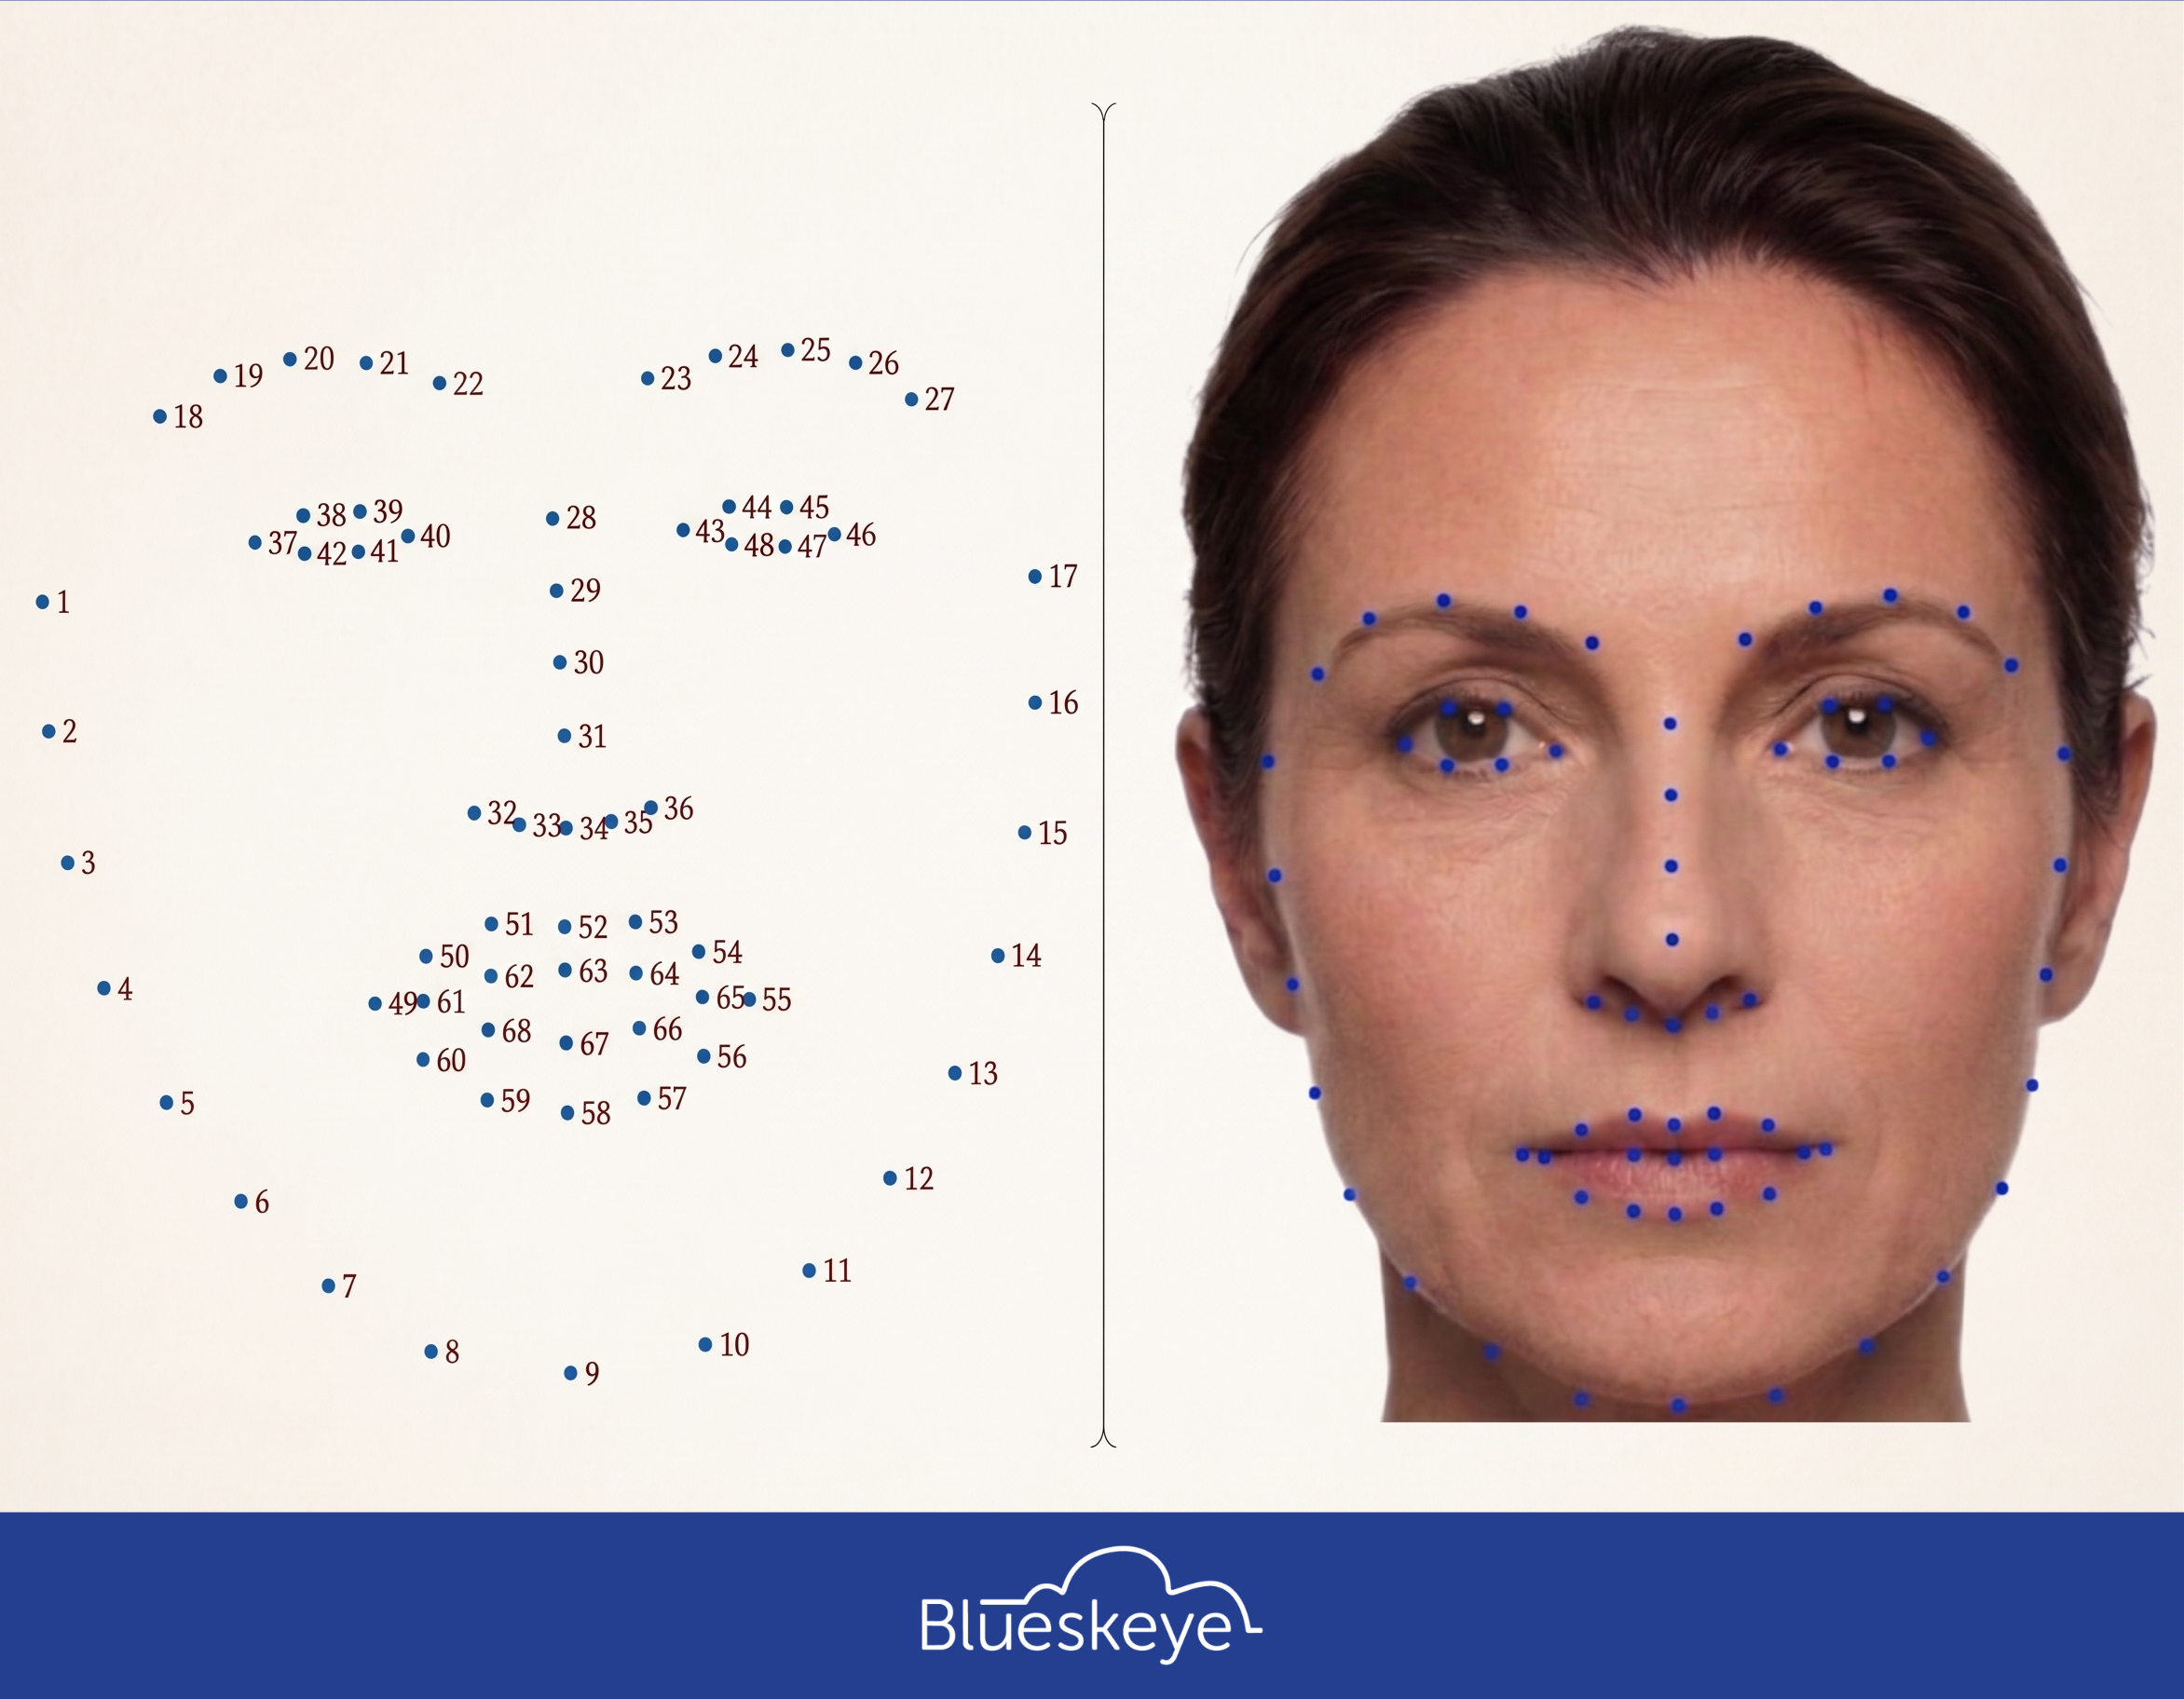
Figure 3. i-BUG format 68 face landmarks template (Image source: ibug.doc.ic.ac.uk/resources/300-W)
¶ 3D Head Pose
Head pose is a 3D vector of head rotation angles around x, y, and z axes, commonly referred to as yaw, pitch, and roll respectively (see Figure 4). In B-Social, these angles are defined w.r.t. the camera centre, i.e. the head pose angle is [0, 0, 0] when the head centre is aligned with the camera centre looking directly into the lens. For an input face image, these angle values are derived from its 68 tracked 2D face landmark locations, given a fixed mean face size and a reference camera intrinsic parameter matrix. In addition to head rotation angles, B-Social also outputs a distance measure, 'Head Z', which is proportional to the distance between the head centre and camera centre. Through camera calibration, this distance measure can be used to compute the actual head-to-camera distance in physical space.
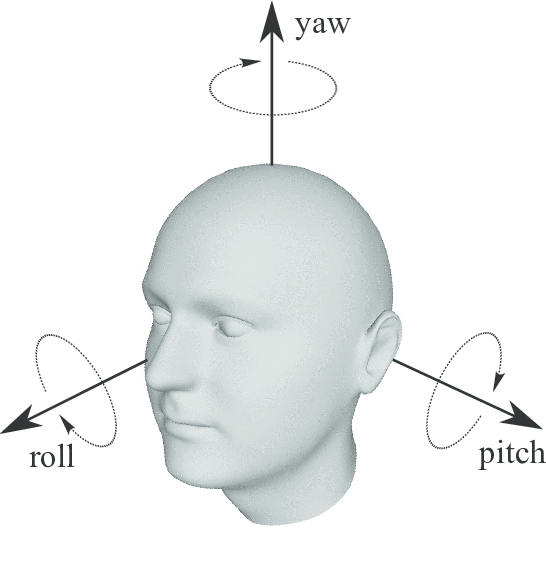
Figure 4. An illustration of the 3D head pose model (Image source: tinyurl.com/yuhua29s)
¶ Face Tracking & Head Pose: API Data Output
| Outputs | Output Structure | Units | Min-Max Value Ranges |
|---|---|---|---|
| Face Bounding Box | [(x_min, y_min), (width, height)] |
Pixels (discrete) | x: [0, Frame width]; y: [0, Frame height]; Width: [0, Frame width]; Height: [0, Frame height] |
| Face Landmarks | [(x_1, y_1), (x_2, y_2), ...., (x_68, y_68)] |
Pixels (discrete) | x: [0, Frame width]; y: [0, Frame height] |
| Face Landmarks Visibility | [v_1, v_2, ...., v_68] |
Boolean | State: |
| Head Pose Angles | Angle: [yaw, pitch, roll] | Angle: Degrees (continuous) | Angle: [-90, +90] |
| Head Position | x, y | Pixels (discrete) | x: [0, Frame width]; y: [0, Frame height] |
| Head Position | z | Floating point value | Distance: [0, 10] |
¶ Face Image Quality Assessment
Environmental factors can impact the quality of the image and thus the capacity to derive insight from that image. B-Social assesses the quality of the image to determine whether the image is within the required thresholds with respect to:
- Blur
- Brightness / darkness
- Image noise
See Figure 5 for examples.
The brightness of an image is measured by taking the average intensity of the V channel of the HSV spectrum of the face image. This average intensity value is used to determine whether the face image is too bright or too dark.
The blurriness of an image is determined by calculating the variance of the Laplacian of Gaussian (LoG) filter applied to the face image and comparing it with a fixed threshold value. Images that produce a value below this threshold are considered blurry images, whereas images with a value greater than the threshold are considered sharp.
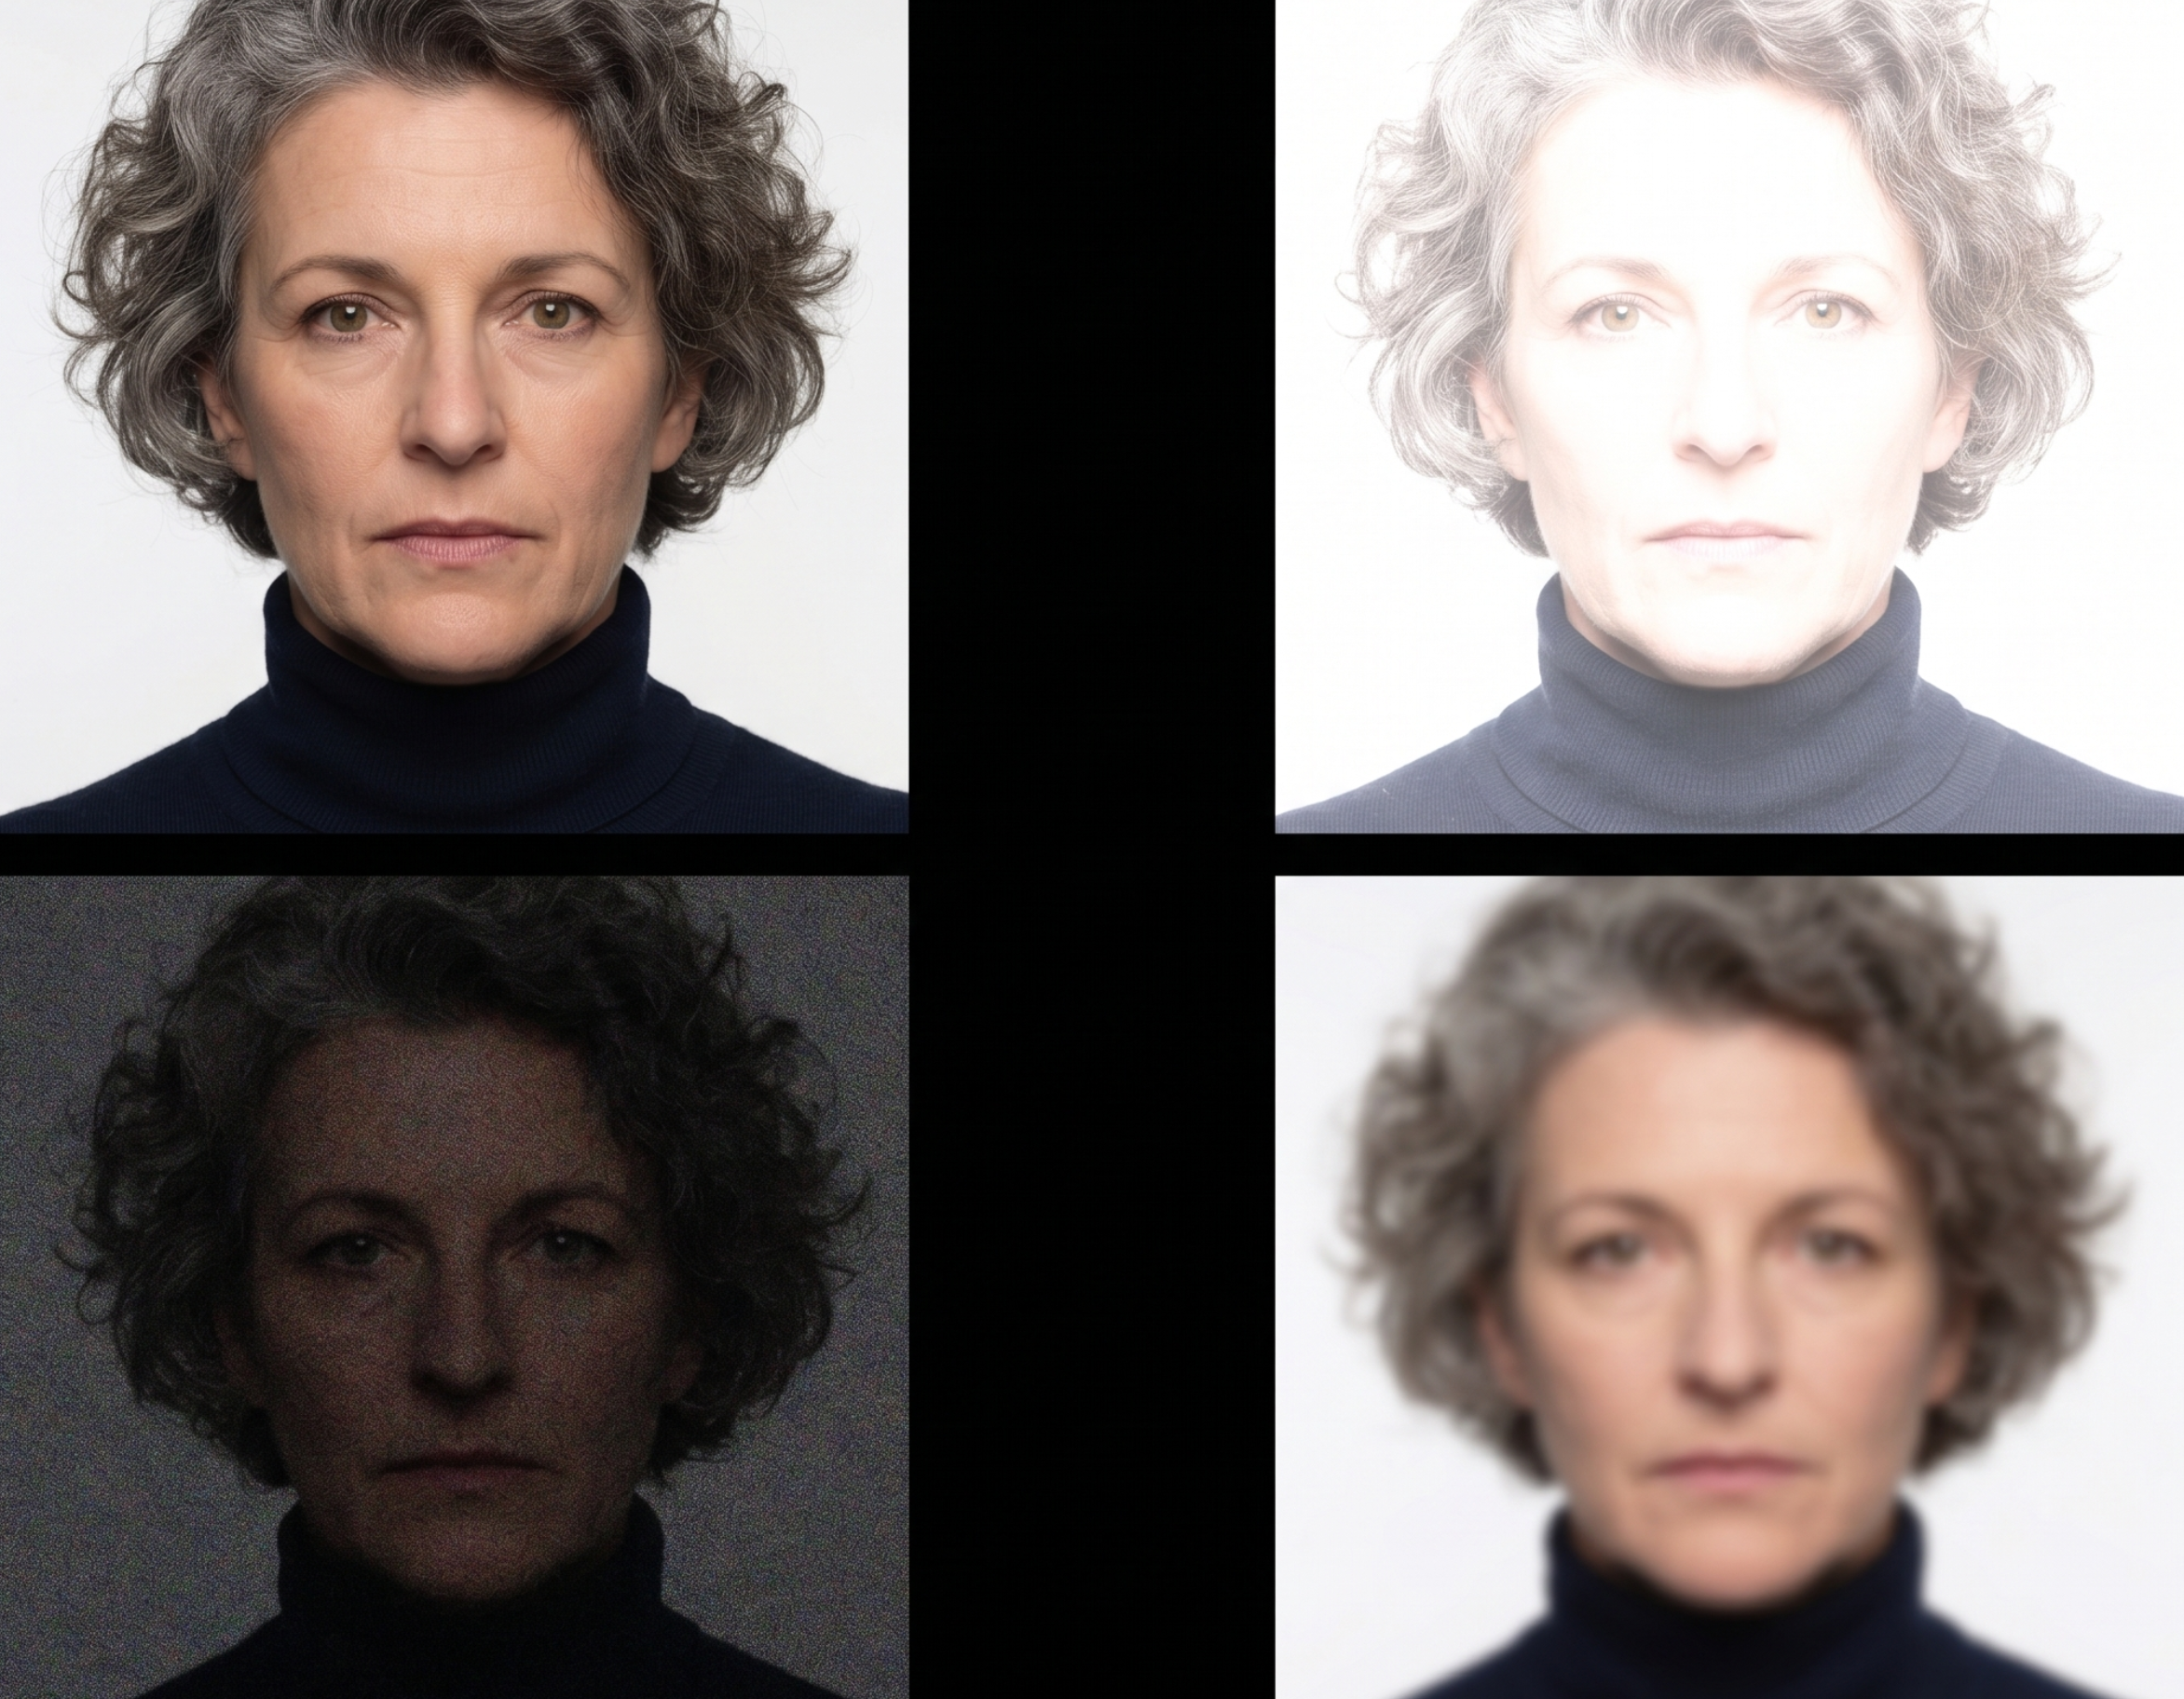
Figure 5. An illustration of (a) blurred (b) too bright and (c) noisy face images
¶ API Data Output
| Outputs | Output Structure | Units | Min-Max Value Ranges |
|---|---|---|---|
| Face Image Quality Metrics | [Blur, Bright / Dark, Acceptable] | Boolean | State: |
¶ Social Eye Gaze Tracking
This provides information about the direction in which the subject is looking, relative to the camera. B-Social outputs a vector which represents the pitch and yaw of the user's eyeballs and the roll of their head. If the user were looking directly into the lens, the pitch and yaw would be zero (not accounting for tolerance). If the roll of the user's head were such that it matched the horizontal plane on which the camera is mounted, then the roll would also be zero.
This feature may be used in conjunction with the measured 3D head pose, extrinsic and intrinsic camera parameters and the 3D location of cabin features, to determine what the user is looking at. Figure 6, below, provides an overview of the gaze prediction pipeline of B-Social.
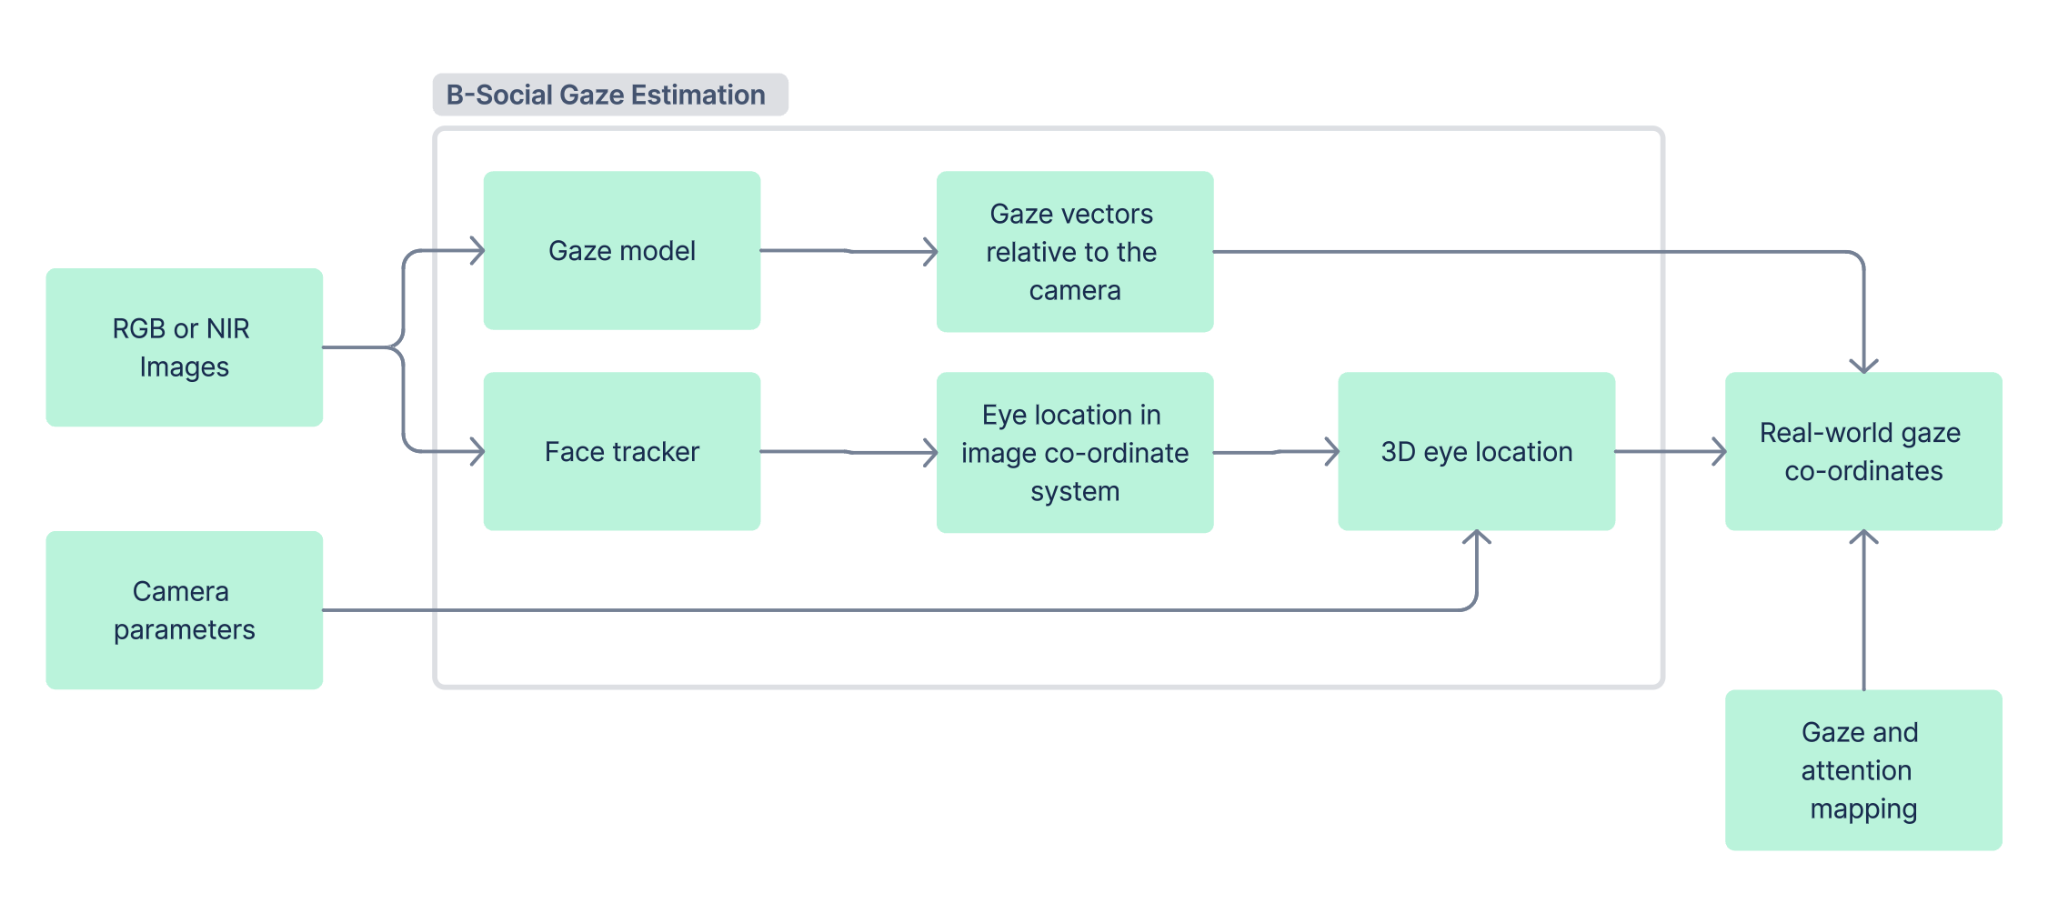
Figure 6. An overview of the gaze estimation pipeline in B-Social
¶ API Data Output
| Outputs | Output Structure | Units | Min-Max Value Ranges |
|---|---|---|---|
| Eye Gaze | Unit Vector: [x, y, z]; Angles: [yaw, pitch] | Unit Vector: -; Angles: Degrees (continuous) | Unit Vector: -1,1; Angle: [-90, +90] |
¶ Attention and Social Gaze
In addition to performing eye gaze tracking, B-Social is capable of performing attention mapping by combining eye gaze tracking predictions with a configurable area mapping to identify what the occupant is looking at within the area mapped. This can be a certain region or an object defining such a region given a camera position. Object regions and camera positions can be loaded into the SDK via a CSV file. The default set of object mappings supplied with the SDK is presented in Figure 7 below.
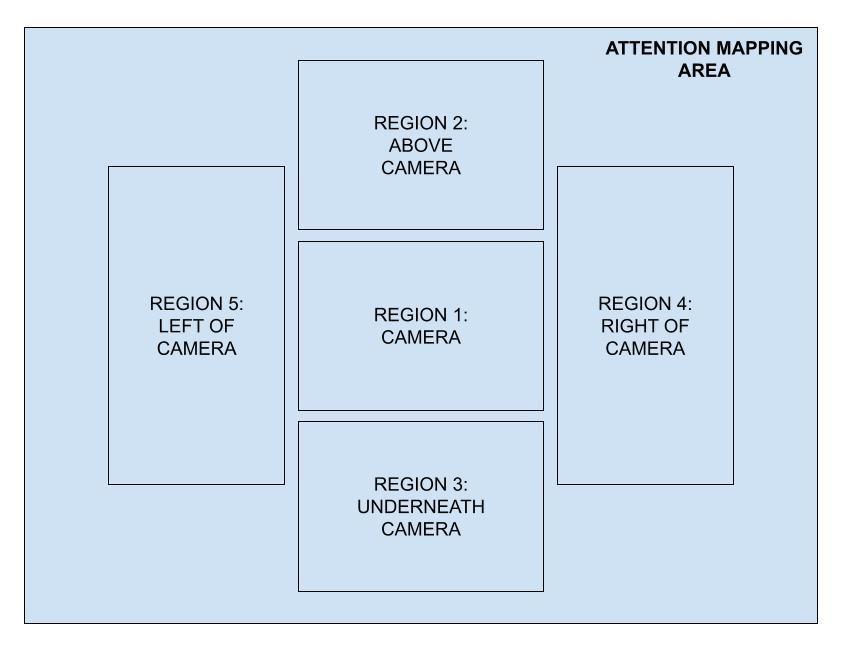
Figure 7. An overview of the sample set of attention mapping regions B-Social comes with
The area positions are stored as four 3-dimensional coordinates that are in relation to the head's position: the top left corner, the top right corner, the bottom left corner and the bottom right corner of the area mapped.
The camera positions are stored as a single 3-dimensional coordinate that is in relation to the head position.
The output from the SDK is a string value that corresponds to a region in the object mappings input file. If no object is found to match the gaze destination point, it sets the current object to "Unknown" and assigns a default object ID.
The occupant's head position within the frame of the video is not used to calculate an offset to the looked-at position, and the distance the occupant's head is from the camera is also assumed to be at a set depth.
Only one camera is supported at present; the location and angle of the camera can be configured, capturing the camera's x, y and z coordinates as well as its pitch, roll and yaw angles.
¶ API Data Output
| Outputs | Output Structure | Units | Min-Max Value Ranges |
|---|---|---|---|
| Looked at object | Object name | String | N/A |
| Looking straight ahead | Looking ahead / not looking ahead state | Boolean | State: |
¶ Facial Action Unit Estimation
For analysing expressed emotions from video data, B-Social adopts two standard computational models of facial expressive behaviour that are widely used in the literature of Affective Computing [1]: Facial Action Coding and the Valence/Arousal dimensional affect space.
¶ Facial Action Unit Coding System
The Facial Action Unit Coding System (FACS) is a comprehensive system developed by Ekman [3] for objectively measuring facial expressions of emotion. The FACS system is based on the idea that there are specific movements of small groups of facial muscles that correspond to different emotional states.
The FACS system has identified 32 facial action units (AUs) [3], which are the smallest, most discrete facial movements that can be made. Each AU is defined by the specific muscles that are used to create the movement, as shown in Figure 8. For example, AU1 involves the raising of the inner eyebrows, while AU12 involves the pulling down of the corners of the lips. Thus, it provides a standardised approach to measuring facial expressions by assigning a numerical code to each AU, based on its intensity and duration. These codes can then be analysed statistically to identify patterns of facial expressions across individuals or groups.
B-Social can accurately recognise each of 15 Action Units and outputs a quantification for each, with values ranging between 0 (inactive) and 5 (fully active):
| Action Unit | Description |
|---|---|
| AU01 | Inner brow raiser |
| AU02 | Outer brow raiser |
| AU04 | Brow lowerer |
| AU05 | Upper lid raiser |
| AU06 | Cheek raiser |
| AU07 | Lid tightener |
| AU09 | Nose wrinkler |
| AU10 | Upper lip raiser |
| AU12 | Lip corner puller |
| AU14 | Dimpler |
| AU15 | Lip corner depressor |
| AU17 | Chin raiser |
| AU23 | Lip tightener |
| AU25 | Lip parts |
| AU45 | Blink |
Figure 8. Facial Action Units measured by B-Social (example images omitted — see original PDF/DOCX for the illustrated reference)
¶ API Data Output
| Outputs | Output Structure | Units | Min-Max Value Ranges |
|---|---|---|---|
| Facial Action Units | 15 D vector | Continuous values | [0, 5] |
¶ Dimensional Affect: Valence & Arousal
Expressed emotion can be quantified on a 2-dimensional numeric scale of valence and arousal. These terms may be defined as follows:
- Valence refers to the degree of pleasantness or unpleasantness of an emotional experience. Emotions that are positive in valence, such as happiness and contentment, are experienced as pleasant, while emotions that are negative in valence, such as fear, sadness and anger, are experienced as unpleasant.
- Arousal refers to the level of physiological activation or energy associated with an emotional experience. High arousal emotions, such as excitement and fear, are associated with increased heart rate, rapid breathing, and other signs of physiological arousal, while low arousal emotions, such as relaxation and contentment, are associated with decreased physiological arousal.
This model is composed of valence and arousal as two orthogonal dimensions, whose linear combinations are used to describe and measure different emotional expressions, as shown in Figure 9:
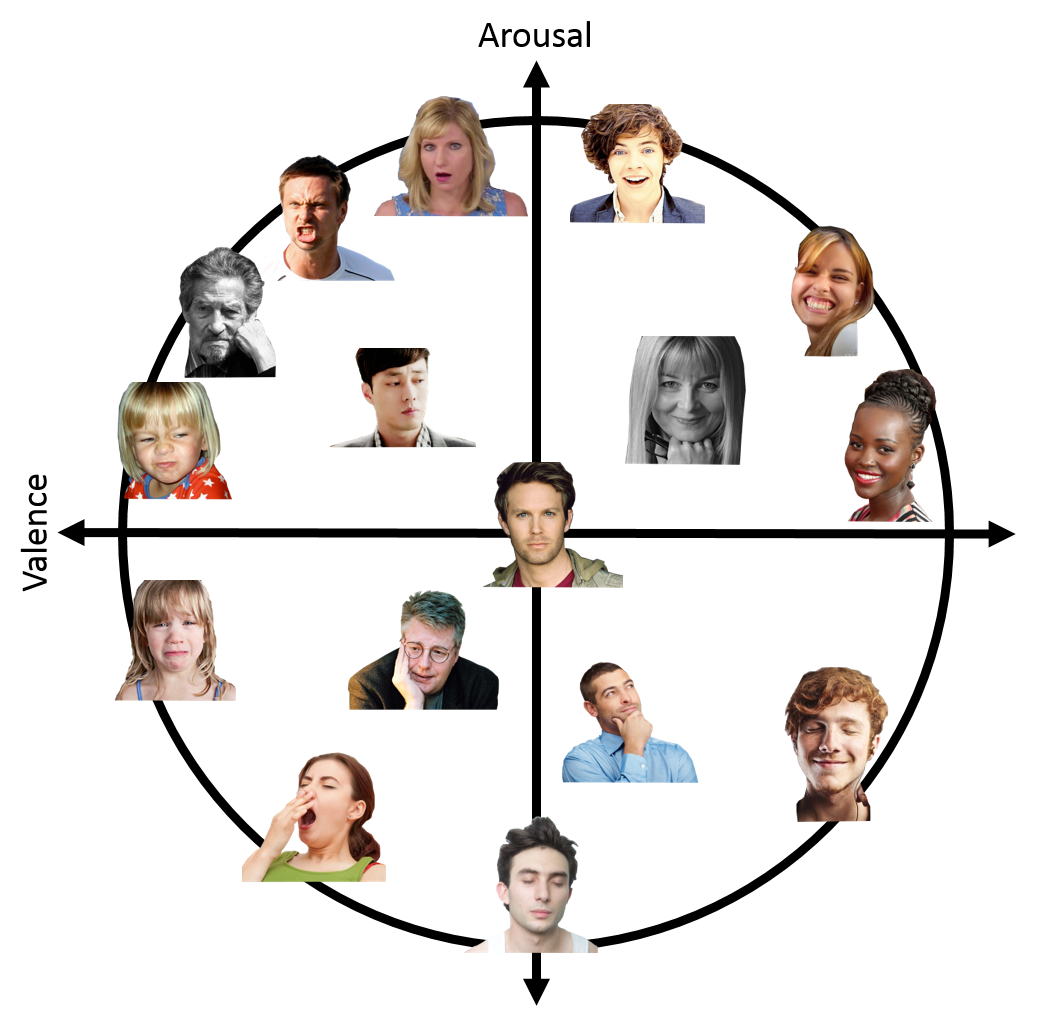
Figure 9: 2-Dimensional model of emotions (Image source: AffectNet [2])
The output is a 2D vector of valence and arousal scores, each in the range of [-1.0, +1.0].
Measuring valence and arousal (VA) using existing methods is challenging. Asking people to rate their own feelings in real time interrupts what they're doing and is often impractical (i.e. you can't do that while driving), and especially to do so continuously.
B-Social's emotion recognition module makes this possible by continuously measuring apparent valence and arousal based on the subject's expressive behaviour. The apparent affect magnitude is the strength of the displayed affect. It measures how far away the measured affect is from the centre of the VA coordinate system. In practice, this is calculated as the magnitude of the apparent VA vector. Measurements for each dimension are output as a floating point number between -1.0 and +1.0.
¶ API Data Output
| Outputs | Output Structure | Units | Min-Max Value Ranges |
|---|---|---|---|
| Valence and Arousal (temporal smoothing applied to raw VA) | 2 D vector | Continuous values | [-1.0, +1.0] |
Temporal Context Aggregation for Affect Recognition. While predicting VA scores of a face in a video frame, it is critical to aggregate the relevant temporal context available in its previous frames [1] [5]. Given the time-continuous nature of dimensional affect labels, recognising dimensional affect requires a temporal model. The dimensional affect recognition model in B-Social takes as input a sequence of 100 consecutive frames, and using that aggregated temporal context information it predicts VA scores for the last frame in that sequence. Due to this temporal context aggregation step, it is expected to observe a delay of 2 to 3 seconds between expressed and predicted facial emotions in B-Social outputs.
¶ 2D Expressed Emotion
Quantifying valence and arousal using a 2-dimensional scale is a reliable way of measuring user state using an objective, fine-grained scale. It allows for continuous measurement of each subject's expressed state, expressed using an objective scale, and it can be used to plot the emotional route that the subject takes as they move between emotional states.
However, it can be useful to quantify emotions in a more familiar way, using vocabulary that we all commonly use to describe such emotions. An approach for achieving this based on the dimensional affect model in B-Social is described in detail in Interpreting B-Social Outputs for Emotional and Mental State Analysis, Appendix 2.
¶ Emotion Zones
In addition to the 2D expressed emotion output covered in the prior sections, B-Social also maps the resulting Valence and Arousal predictions into a set of predefined emotion zones each labelled using a common vocabulary normally used to refer to such emotions.
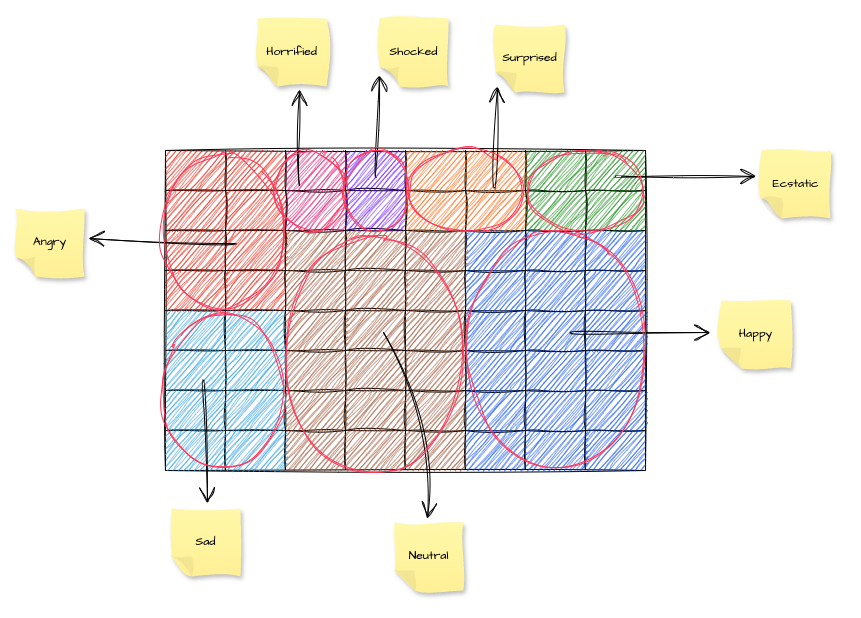
The SDK maps Valence and Arousal predictions to 8 various emotion zones listed below:
- Neutral
- Happy
- Ecstatic
- Surprised
- Shocked
- Horrified
- Angry
- Sad
Each set of Valence and Arousal predictions generated by the SDK results in a set of probability values ranging from 0 to 1, one per each of the emotion zones, indicating which emotion label most accurately represents the current emotion state displayed by the subject tracked.
Note: The emotion zones can be configured for your specific application by Blueskeye — contact us for more information.
¶ API Data Output
| Outputs | Output Structure | Units | Min-Max Value Ranges |
|---|---|---|---|
| 8 emotion zone labels | 1 D vector | Strings | N/A |
| 8 emotion zone confidence | 1 D vector | Continuous values | [0.0, 1.0] |
| Emotion zone label with the highest probability | String | String | N/A |
¶ Expressed Mood
The terms 'emotion' and 'mood' are frequently used interchangeably in everyday language; they signify distinct affective states in academic literature. 'Emotion' refers to short-term, intense, and focused affective experiences, whereas 'mood' denotes long-term, subtle, and less overt affective states.
B-Social's expressed mood output provides a continuous-valued apparent mood score on the scale of [-1.0, +1.0].
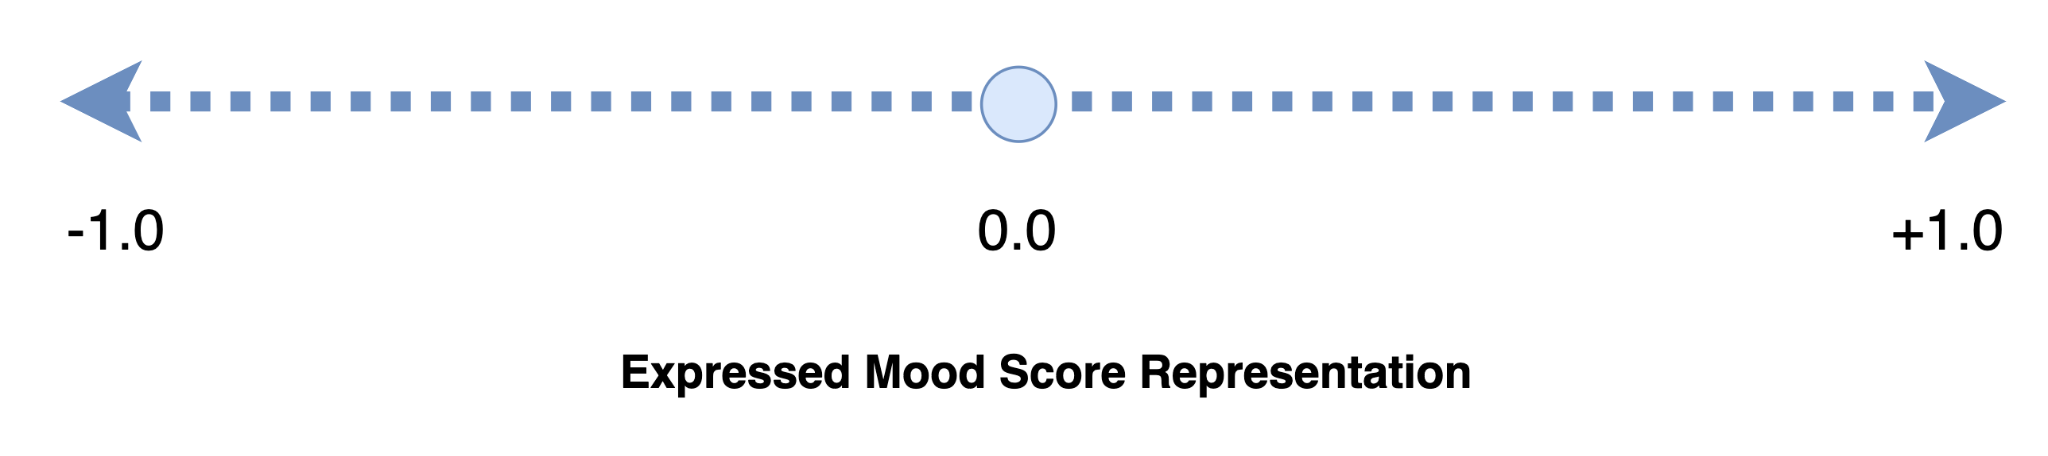
Figure 10: Expressed mood score representation
The polarity of this score indicates the positive or negative nature of the expressed mood, whereas its magnitude quantifies the intensity of the expressed mood state. The duration of a time window is a minimum of 10 seconds and a maximum of 5 minutes. For interactions over 5 minutes, the preceding 5 minutes is used to calculate the mood score.
¶ API Data Output
| Outputs | Output Structure | Units | Min-Max Value Ranges |
|---|---|---|---|
| Expressed Mood | Mood score | Continuous value | [-1.0, 1.0] |
¶ Visual Voice Activity Detection
Visual Voice Activity Detection identifies whether or not the subject is talking, using visual observation only. This can be used in conjunction with other data, to determine whether a voice command was issued by the subject in multi-user scenarios.
¶ API Data Output
| Feature | Output Structure | Units | Min-Max Value Ranges |
|---|---|---|---|
| Visual Voice Activity Detection | Speaking / Non-speaking state | Boolean | State: |
¶ Appendices
¶ Appendix 1: Terminology
This section provides a brief overview of the essential terminology of the facial behaviour analysis pipeline used in B-Social.
Face Bounding Box denotes the 2D location and size of a face region within an image. See Face Detector for more information.
Face Landmarks are 2D fiducial points on face images, denoting key locations such as eye corners and nose bridge, etc.
The Facial Action Unit Coding system, also known as FACS, is a comprehensive system developed by Ekman [3] for objectively measuring facial expressions of emotion. This system captures the movements of different facial muscle groups by defining the occurrence and intensity values of their corresponding Action Units (AUs).
Dimensional Model of Affect / Emotion defines facial emotion expressions on a three-dimensional space composed of three orthogonal axes: valence, arousal, and dominance. Linear combinations of these three dimensions are used to describe and measure facial emotion expressions. Here are brief definitions of each dimension:
- Valence refers to the degree of pleasantness or unpleasantness of an emotional experience.
- Arousal refers to the level of physiological activation or energy associated with an emotional experience.
Apparent Dimensional Affect describes how one's affect is perceived from their expressive behaviours.
Head pose is represented as a 3D vector of head rotation angles around x, y, and z axes, commonly referred to as yaw, pitch, and roll respectively, with respect to the camera.
Eye Gaze vector provides information about the direction in which the user is looking, relative to the camera. When looking directly into the lens, the eye gaze would be zero for each dimension.
Cognitive mental states refer to various mental processes involved in thinking, perceiving, remembering, and reasoning. These mental states include a wide range of cognitive functions such as perception, memory, problem-solving, attention, decision-making, and linguistic processing, etc. Changes in these states underpin behaviours like inattention, drowsiness, panic, confusion and frustration, etc.
¶ Appendix 2: Data Application Guide
This section describes how to interpret B-Social outputs in analysing different emotional expressions and mental states encountered in driving scenarios.
¶ Interpreting B-Social Outputs for Emotional and Mental State Analysis
Expressed emotional and mental states can be interpreted as categorical or continuous states. B-Social adopts a continuous approach (apparent VA) as it better fits the real human experience of emotional states and avoids having to quantify the fuzzy boundaries and subjective definitions of discrete emotional states between different individuals. This continuous measure of state, where appropriate, can be mapped back to a categorical representation. To provide a continuous measure of emotional and mental states, B-Social considers primarily the visual[1] attributes based on facial, head pose and gaze behaviour of the occupant over a defined time window. These expressed behaviours over time are then used to predict the valence and arousal (VA) scores for an occupant using a deep learning-based temporal model. These valence and arousal scores are continuous and take the temporal dynamics of expressed emotion into account.
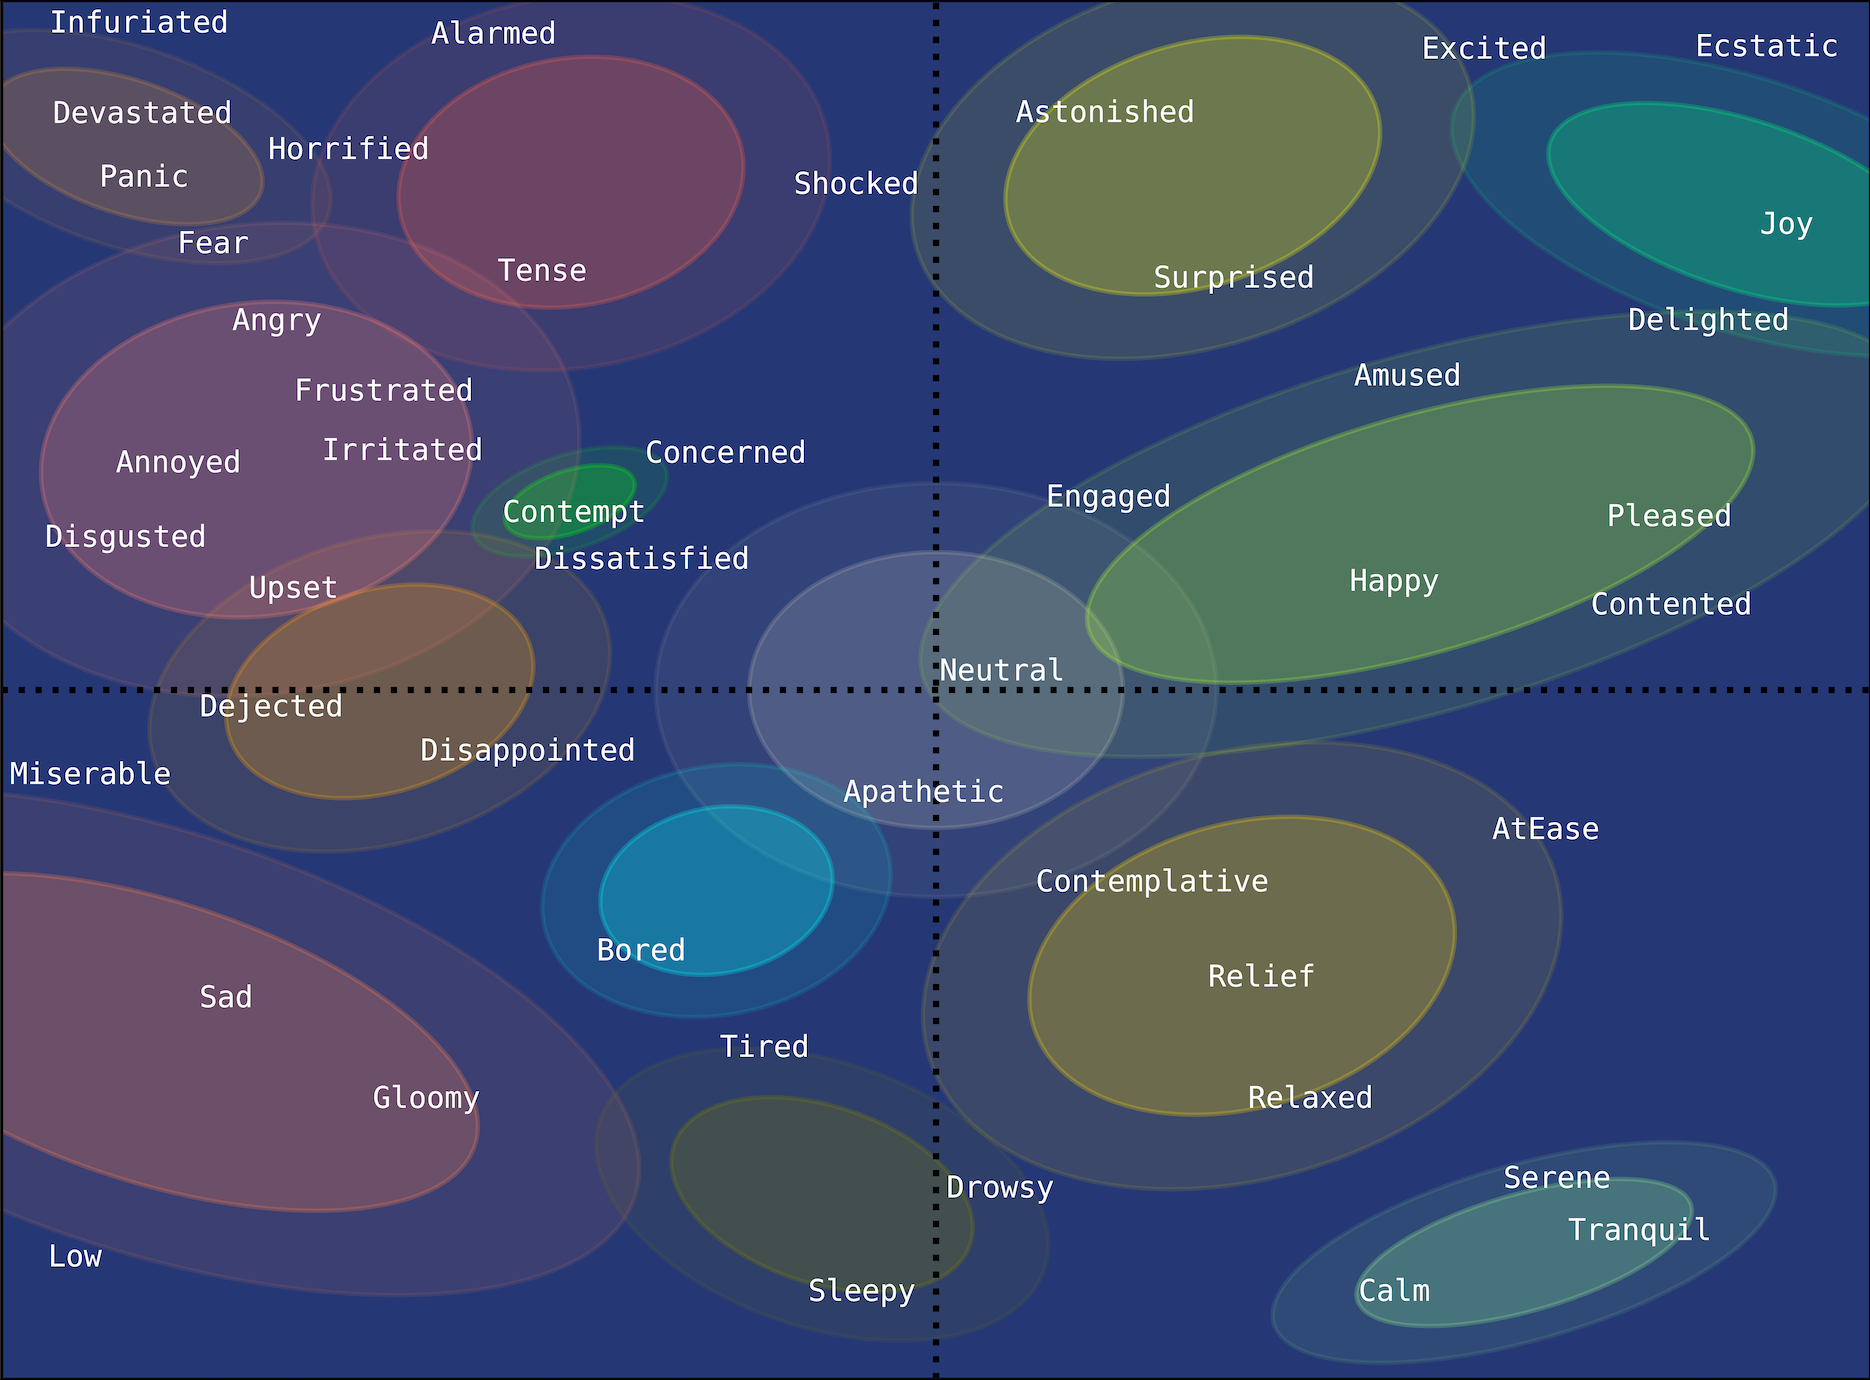
Figure 11. A detailed mapping between categorical emotions and different locations on 2D VA space (Image source: [5])
Figure 11 shows how valence and arousal scores can be used to define a 2D[2] VA space that covers all possible underlying emotional states. This space can then be subdivided into regions. At a high level, the four main regions are:
- High Arousal, Positive Valence: Emotions in this quadrant include excitement, joy, and love. These emotions are associated with high levels of physiological arousal and positive feelings.
- High Arousal, Negative Valence: Emotions in this quadrant include anger, fear, and anxiety. These emotions are associated with high levels of physiological arousal and negative feelings.
- Low Arousal, Negative Valence: Emotions in this quadrant include sadness, boredom, and depression. These emotions are associated with low levels of physiological arousal and negative feelings.
- Low Arousal, Positive Valence: Emotions in this quadrant include relaxation, contentment, and satisfaction. These emotions are associated with low levels of physiological arousal and positive feelings.
Due to the subjective nature of felt and expressed human emotion, it is possible to work in the VA space without defining the label for the underlying emotional state. To do this, we define areas within the VA space that encompass a set of emotions or a general feeling that we are trying to achieve. As illustrated in Figure 12, we refer to these as Goldilocks Zones. These zones are context-specific, and the specification of the zone can be impacted by several factors such as the task being undertaken or the desire of the individual to reach a certain state. Definition of these zones for an automotive context is ongoing research and may be tailored to align with a specific brand.
To help understand and communicate the VA space it is sometimes useful to use Russell's Circumplex Model of Emotions (see Figure 11) to translate the continuous representation to a discrete emotion or state label. The above four quadrants can be further broken down into more fine-grained regions to get an indication of the current state of the occupant. However, it should be noted that the more fine-grained the state, the more likely it will be vulnerable to individual and cultural differences. Exploring how VA maps to this space, and the effects of culture and heritage, is an ongoing area of research.
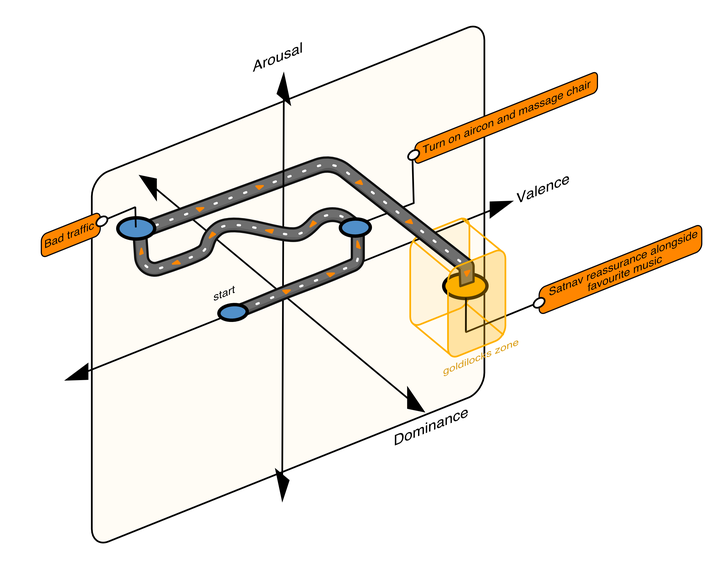
Figure 12. An example of a journey through the dimensional affect space with suggested interventions
¶ Appendix 3: Physical System Overview
The physical setup needed to deploy the BLUESKEYE AI technology consists of one camera for each monitored occupant. The positioning of the camera will play an important role in maintaining system performance across a range of head and body motions. While the ideal positioning of the camera is frontal relative to the face, our system is robust to yaw and pitch variations such that placing the camera to ensure good performance is possible for most use cases.
Image quality is also an important factor, and it can be affected by variations in light intensity from the environment. We recommend the use of near-infrared cameras in combination with a visible light filter and near-infrared light emitters, although in most cases RGB can be used in indoor settings with good lighting. For detailed camera specifications see the camera section under hardware requirements.
¶ Component Connectivity
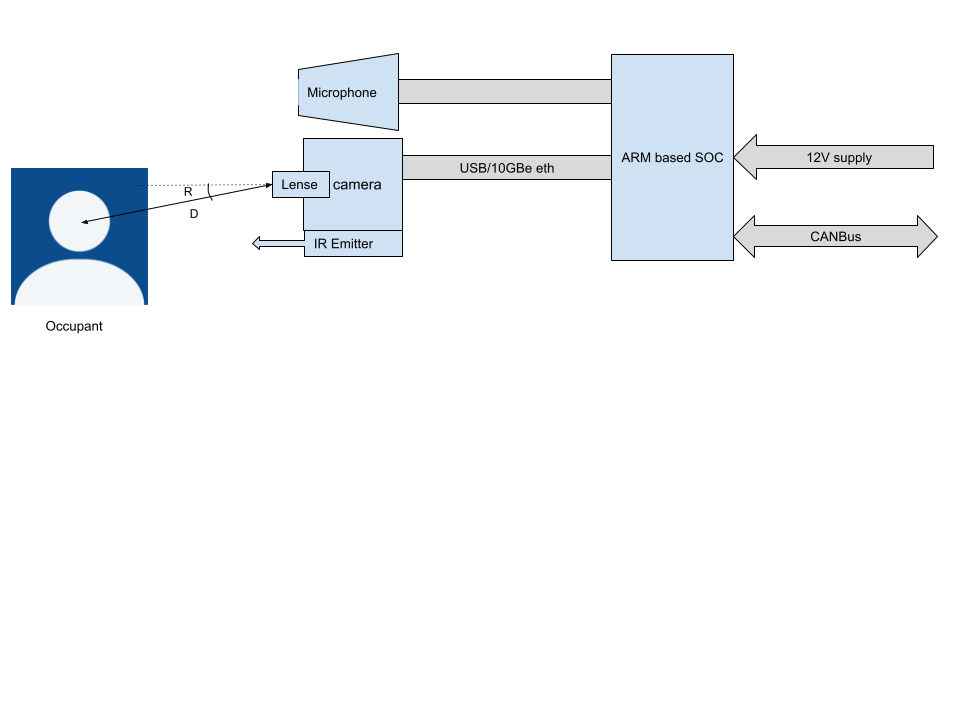
| Key | Meaning | Validated Range[3] |
|---|---|---|
| R | Angle between face centre and the camera | Yaw: +/-30 deg; Pitch: +/-15 deg |
| D | The distance to the camera and the nose tip | 0.4m - 1.0m |
Figure 13. Physical hardware diagram
Figure 13 shows the main components and their interconnections at a high level required for B-Social to function. Detailed specifications for each component can be found in the Hardware Requirements section.
¶ Appendix 4: Input Requirements
¶ Video/Image
It is recommended that the video input to B-Social meets the following minimum requirements. Note that the current feature set of B-Social works well with even compressed video frames.
- 24-bit 3-channel NIR or RGB images of unsigned 8-bit long integer pixel type
- 15 frames per second
- 256 x 256 pixels face dimensions
¶ Appendix 5: Hardware Requirements
This section outlines the hardware requirements for B-Social.
¶ Camera
B-Social currently supports the use of a single camera for each occupant. The field of view of the camera should be wide enough to accommodate the potential range of motions, positions and occupant sizes. A key requirement is the size of the occupant's face in the images; we recommend that this be at least 256x256 pixels.
The table below shows suggested camera specifications to meet the image input requirements in a standard use case. Please note that a key requirement is for the face image size to be at least 256 pixels square, and that this may be met using hardware of a different specification.
Imager
| Property | Value |
|---|---|
| Frequency band (RGB/FIR/NIR) | NIR |
| Lens | 1/2.5'' 3.6 mm |
| Resolution | 1920 (w) x 1080 (h) |
| Pixels/deg (horizontal) | 26.12 |
| Pixels/deg (vertical) | 23.68 |
| Pixel coverage on face | 170x170 minimum |
| Bounding box | Face + padding |
| Target minimum number of pixels in bounding box | 256 x 256 |
| Pixel size | 2.8 µm x 2.8 µm |
| Field of View H | 597 mm - 1190 mm |
| Field of View V | 336 mm - 672 mm |
| Minimum frames per second | 15 fps |
| Shutter type (rolling, global) | No preference |
| Video format | Raw pixel data in BRG format |
Integration
| Property | Value |
|---|---|
| Positioning of Camera | Eye line < 30 degs from face centreline looking forwards |
| Distance to target | 0.4m - 0.8m |
| Field of View (content) | Head, upper torso |
We have performed internal testing of our automotive product using the Omnivision OV2710 and the Sony IMX323. Cameras based on these sensors are good candidates for POC evaluation.
¶ NIR Emitters
B-Social has been tested on cameras with 10 NIR LED emitters of wavelength 850nm, with an irradiation angle of 90° and an irradiation distance of 6-10m. These ensure uniform illumination of the face at the expected working distance.
¶ Computation
B-Social has been designed to run on the edge, on a variety of operating systems and hardware configurations, and so leaves the client free to select their own hardware. Please contact us for more details of performance benchmarking. For CPU-only applications, 70K DMIPS is recommended to run the full feature set. Where ML accelerators are available (GPU or DSP) these can be leveraged to reduce CPU load significantly to 20K DMIPS, although achieving this may require specific optimizations for your hardware. In a resource-constrained environment we have a number of options available to decrease the computational load — please contact us to discuss your requirements.
¶ Appendix 6: Software Operating Environment
This section presents an overview of the software platforms currently supported by B-Social, whether for the purposes of integration into a car onboard computer system for live analysis or offline processing of videos captured inside the vehicle.
B-Social currently supports the following CPU architectures:
- X86
- ARM
on Linux platforms that provide:
- Kernel version 5.15 or above
- GLIBC version 2.27 or above
- GStreamer 1.14.5 or above. This dependency is currently required, however it can be removed as it is only used to decode input videos, which is not essential for B-Social functionality.
- GTK version 2.24.32 or above, but lower than version 3. This dependency is currently required, however it can be removed as it is only used to display prediction overlays, which is not essential for B-Social functionality.
¶ Appendix 7: References
- Sanchez, Enrique, et al. "Affective processes: stochastic modelling of temporal context for emotion and facial expression recognition." Proceedings of the IEEE/CVF Conference on Computer Vision and Pattern Recognition. 2021.
- Mollahosseini, Ali, Behzad Hasani, and Mohammad H. Mahoor. "Affectnet: A database for facial expression, valence, and arousal computing in the wild." IEEE Transactions on Affective Computing 10.1 (2017): 18-31.
- Rosenberg, Erika L., and Paul Ekman, eds. What the face reveals: Basic and applied studies of spontaneous expression using the Facial Action Coding System (FACS). Oxford University Press, 2020.
- Posner, Jonathan, James A. Russell, and Bradley S. Peterson. "The circumplex model of affect: An integrative approach to affective neuroscience, cognitive development, and psychopathology." Development and psychopathology 17.3 (2005): 715-734.
- Kollias, Dimitrios, et al. "Deep affect prediction in-the-wild: Aff-wild database and challenge, deep architectures, and beyond." International Journal of Computer Vision 127.6-7 (2019): 907-929.
- Jaiswal, Shashank, and Michel Valstar. "Deep learning the dynamic appearance and shape of facial action units." 2016 IEEE winter conference on applications of computer vision (WACV). IEEE, 2016.
- Wu, Yue, and Qiang Ji. "Facial landmark detection: A literature survey." International Journal of Computer Vision 127 (2019): 115-142.
Audio information can also be used but this does not generalise well to noisy multi-occupant environments like automotive cabins. This is an area of internal research at BlueSkeye AI. ↩︎
Dominance will be added to B-Social which in future will create a 3D VAD space. ↩︎
The validated range indicates the conditions in which the capability has been trained and validated. It will likely work beyond this range, depending on other factors including light source and camera specification. ↩︎